Knowing how well your campaign is working is tough if you’re a medical practice running Google Ads. Standard benchmarks for ad performance might not work because they don’t apply to healthcare.
Our team at RUNNER has been able to aggregate data from a number of campaigns and identify some reliable benchmarks specific to medical practices. We use these benchmarks to guide our own campaigns — and because they work for us, we want to share them with other healthcare professionals.
These benchmarks are based on a wide variety of Google Ads campaigns — built and managed in-house at RUNNER. Our campaigns target different geographies and many different types of medical practice specialties — everything from Spine Surgeons to Med Spas.
While our Google paid search benchmarks leverage large data sets and include a variety of specialties, we must insert a disclaimer — each healthcare practice is unique.
But these benchmarks should help you understand whether you’re getting the best possible performance out of your campaigns. Remember, we are exclusively discussing Google paid search benchmarks.
The Google paid search benchmarks that we consistently and frequently evaluate, discuss and optimize are click-through rate, lead conversion rate, lead-to-patient conversion rate. Let’s dive in!
Google Paid Search Benchmark #1: Click-Through Rate
A click-through rate (CTR) shows how often searchers click on your ad. To calculate a CTR, divide the number of ad clicks by ad impressions then multiplied by 100.
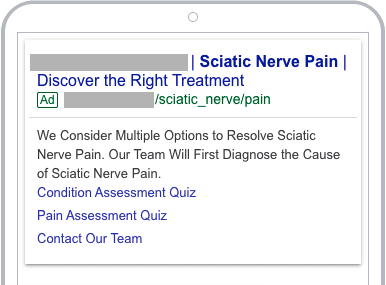
For example, the PPC ad below received 3,443 impressions, meaning it was seen/visible on a page 3,443 times. The ad was clicked 182 times.
182/ 3,443=.05286×10=5.29%

Client identifiers have been redacted for privacy.
At RUNNER, we typically see a 4% to 5% average CTR for mature, optimized healthcare campaigns.
This is far above the overall Google Ads average CTR of 1.91%, and it’s worth noting that this is an average and CTR varies by individual keyword.
For specific keywords like “how to fix sciatica”, where a CTR might be 50% – the average is balanced out by keywords like “sciatica pain relief” where the CTR might be 3%.
By “mature” we mean campaigns that are at least 90 days. By “optimized” we mean the campaigns check these sorts of boxes:
- Thoughtful positive and negative keyword lists
- Compelling text ads
- Competitive bids and daily budgets
If your average CTR falls below this range, think about why that may be.
- Are your keywords as relevant as they should be?
- Are you targeting “high-intent” keywords?
- Are your ads relevant to the keywords you’re buying?
- Are you providing a persuasive call-to-action relative to your competitors?
Now, a high CTR doesn’t automatically mean you’ll enjoy similar success with lead conversion and patient conversion.
People may find your ad relevant, and thus click —but what happens once they land on your website?
Google Paid Search Benchmark #2: Lead Conversion Rate
Lead conversion rate indicates how often visitors from your Google search ads convert 1) directly from your ad (via the click-to-call feature) or 2) on your website.
To calculate lead conversion rate, divide the number of lead conversions by the number of ad clicks, then multiply by 100.
For example, if your PPC ad was clicked 182 times, and of those 182 clicks, 9 people filled out a form on your website, your lead conversion rate is 4.95%.
9/192=.04945×100=4.95%
It’s worth emphasizing that lead conversion rate is a measure of your website’s conversion strength. What influences a website’s ability to convert traffic? We’re talking about things like:
- Landing page copy
- Website layout
- Message and call-to-action clarity
- Website speed
- Overall design
Let’s also think about website conversion “pathways”. Do you have at least one contact form option? What about a phone number in the upper right-hand corner of the site?
With RUNNER campaigns we tend to see an average lead conversion rate of around 4% to 5%.
Now, does our team see higher conversion rates on some campaigns? Absolutely! It’s possible to see double-digit conversion rates for clients with great landing pages and strong calls-to-action.
Conversion specialists Unbounce, in their latest 2020 conversion benchmark report, found the average conversion rate for all landing pages at 3.2%, with Medical Practitioners averaging just 2.4%.
Google Paid Search Benchmark #3: Lead-to-Patient Conversion Rate
Patient conversion rate makes the difference between securing a patient and squandering a good lead opportunity.
After converting ad impressions into clicks, and clicks into leads —you have the mighty task of converting leads into patients. To calculate this, you take patient conversions, divided by lead conversions, multiplied by 100.
For example, if your PPC ad was clicked 182 times, then 9 people filled out a form on your website, and 1 person books a visit at your medical practice, your patient conversion rate is 11.11%.
1/9=.11111×100=11.11%
This step has everything to do with your patient experience team (ie, the folks that directly interact with and nature potential patients) and the technology they use.
Here are a few questions to ask:
- Does that team book patients quickly, efficiently, and compassionately?
- Do potential patients have the option to book online and over the phone?
- What about the ability to communicate with the team via SMS?
In addition to your booking process, the conversion rate will also depend on the types of treatments you advertise. If potential patients are looking for more costly treatment, then the conversion will be more difficult.
Don’t forget to consider the insurance plans your practice accepts. For example, accepting Medicare will almost assuredly lead to higher rates (CTR and lead conversion, in addition to patient conversion).
Because of the above factors, the patient conversion rate is the most difficult to benchmark.
In cases where patient acquisition runs pretty smoothly, we see lead-to-patient conversion rates between 5% and 10%.
That said, we absolutely see positive ROI on campaigns posting lower rates. Sometimes these rates are between 1% – 3%. How do we know they are still profitable?
Well, at the end of the day, the cost per patient and your average revenue per patient make or break a campaign. If your campaign drives an acceptable cost per patient given your revenue, you can literally afford to be more flexible with the patient conversion rate.
Using Google Paid Media Benchmarks
These benchmarks should give you an idea of the kind of results you should expect from a Google Search Ads campaign when it’s being managed by a medical marketing agency that understands patient acquisition.
They should provide you with some insight into which stage of marketing you may be having the most challenges with.
- Low CTR? You need to work on your Google Ads and ad messaging.
- Low Lead Conversion Rate? Your site needs some work to better create leads.
- Low Lead-to-Patient Conversion Rate? Look at how leads are being handled.
Calculating the ROI of Google Ads for Your Medical Practice
Once you clearly understand how your campaign is performing, you can combine these KPIs to calculate the return on investment for your Google Ads spend.
In fact, we created a complete Medical Marketing ROI template to show you how we calculate return on Google Ads for Medical Practices using the same methodology we use at RUNNER.
The good news is that RUNNER can help you with all three. Our proven journey-aligned Google paid media approach is organized around the patient experience. This method has helped us generate thousands of new patients and millions in revenue for our clients.
If you’d like expert Google paid media guidance, request a consultation or give us a call at (214) 396-8500.
More like this: 43 Ways to Attract New Patients to Your Practice in 2022


